Stage-Specific Dashboards
For every stage in the flow (starting from Lint to Routing), EDACloud generates a dedicated dashboard.
Common Layout
Each stage dashboard follows a consistent structure:
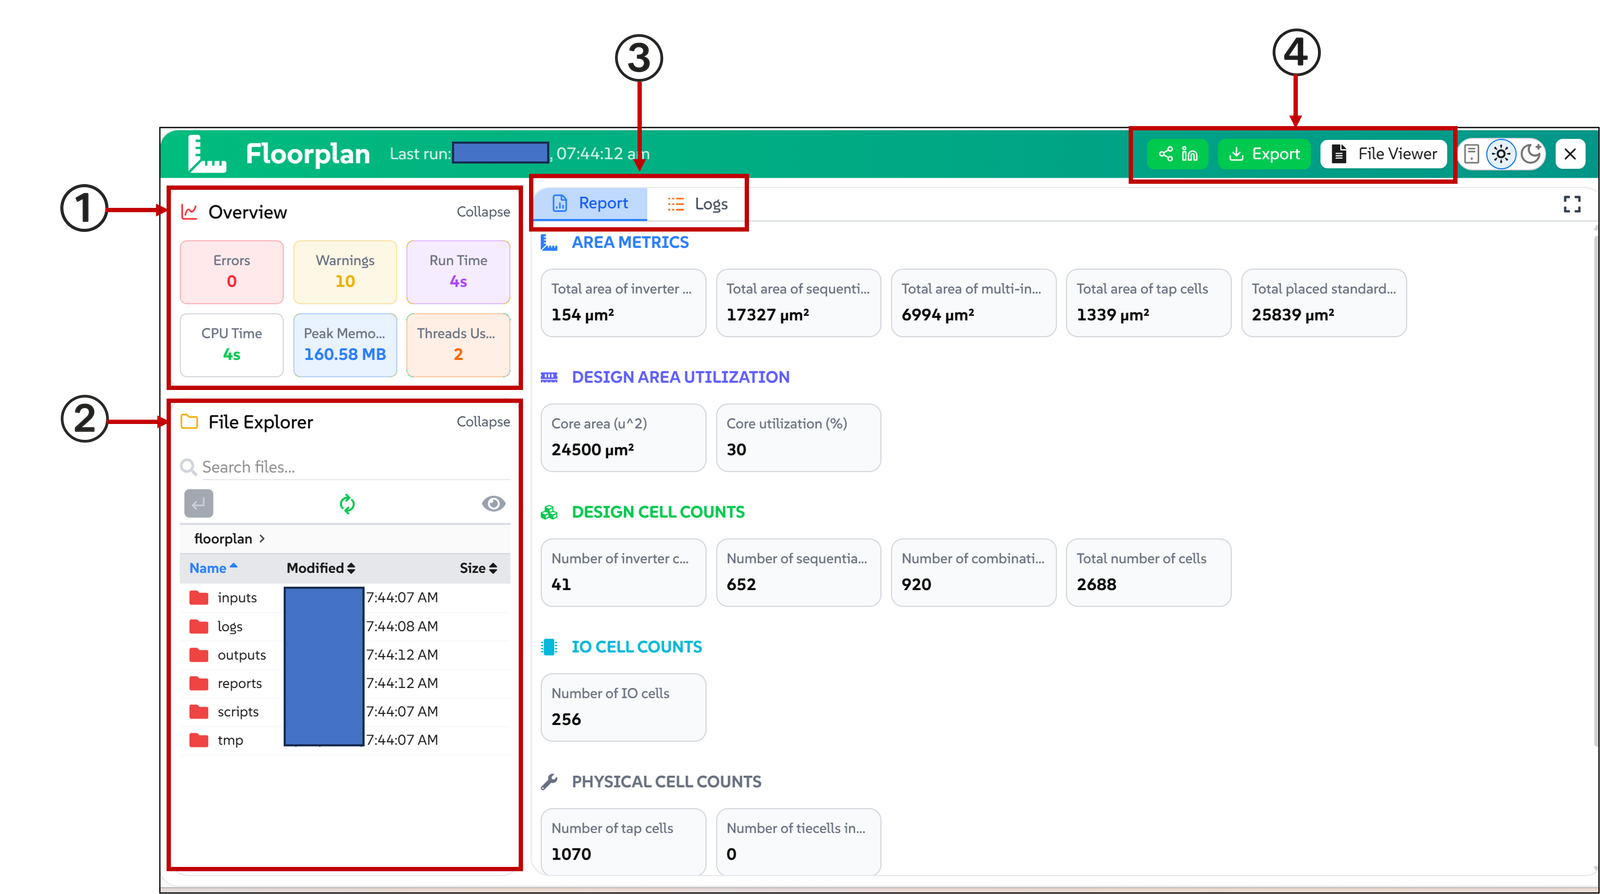
1. Overview Panel
- Displays key execution details:
- Errors and warnings
- Run time
- CPU time
- Memory usage
- Thread count
2. File Explorer
The File Explorer provides access to the design run directory, displaying all files generated during a specific run:
- inputs/ – Input files used for the run
- outputs/ – Generated design outputs
- reports/ – Run reports
- logs/ – Execution logs for debugging
- scripts/ – Tool and flow scripts
- tmp/ – Temporary files created during execution
3. Report and Logs Tabs
- Report
- Presents stage-specific metrics in a structured format
- Examples:
- Synthesis: Cell count, ports, wires
- Floorplan: Area metrics, utilization, cell distribution
- STA: Power breakdown, timing-related metrics
- Presents stage-specific metrics in a structured format
- Logs
- Provides access to detailed execution logs
- Useful for debugging failures or warnings
4. Share, Export and File Viewer
These dashboards provide additional utilities for exporting and accessing design data:
- Share Provides an option to share reports directly on LinkedIn, facilitating quick collaboration and visibility
- Export
- Allows users to export reports in multiple formats, including PDF, PPT, Excel, and JSON
- Enables downloading of logs in text format for offline analysis and debugging
- File Viewer
- Allows users to inspect generated files directly within the platform
These features enhance accessibility, simplify report sharing, and reduce dependency on external tools for analysis and collaboration.
Key Metrics Displayed
The key metrics displayed in a dashboard depend on the specific stage of the flow being analyzed. Each stage presents metrics relevant to its function, enabling targeted analysis and debugging.
For example, in a Floorplan dashboard, the reported metrics focus on physical design characteristics such as area distribution, utilization, and cell placement statistics.
Typical metrics across different stages include:
- Area Metrics
- Total cell area
- Core utilization
- Cell Counts
- Combinational and sequential cells
- IO and physical cells
- Power Metrics (STA)
- Clock, combinational, and sequential power
- Total power consumption
These metrics are derived from the outputs of each run and are populated into the dashboards.